
Now is as cheap as ever to buy a home – The cost vs price of property
It’s really sad that young people feel like their chances of ever owning a home are diminishing by the day or believe it’s impossible.
The media also fuels this idea as they run their fear mongering stories for clicks and stir up negative comments on their boosted articles on Facebook.
The thing is, when do you ever hear about the thousands of successful young first home buyers? Recently first home buyers made up 24% of the market, the highest rate of first home buyers purchasing property in the market in over a decade (with the average being 21%)(1). If it is so impossible, how are they doing it?
The reality is, the cost of buying a home is as expensive as it was 20 or even 30 years ago, the price has changed, but the cost has stayed relatively constant.
Price vs Interest Rates
There’s a lot of talk about interest rates at the moment as they continue to surprise people with how low they continue to go. At the same time, house prices continue to climb.
A 1-2% change in the interest rate can save you hundreds of dollars per week, eg. if you borrow $1m at 3.5% (pre-Covid) you’d be paying $1,035 per week (principal and interest). If the interest rate drops to 2.25% (which it is now), your payments would drop to $882 per week, that’s a difference of $153 per week, $663 per month! ($153×52/12)
That $153 spare per week, now means you can service (how easily you pay the debt) an extra $113,000 of borrowing. (Using ANZ test rate of 5.8%)
This example shows how suddenly people are more comfortable to pay that much more for a property than they would have a year ago.
If we compare this to 30 years ago, in January 1991, the interest rate was a whopping 11.5%… if you borrowed $1m back then you’d be paying $2,284.33 per week!(3) That’s nearly $1,500 more per week. Keep this in mind as you go through the rest of this article.
Population and Supply
In 2000 the population in Auckland was about 1.1m people. Now, in 2021 the population is likely around 1.7m people, that’s a lot more people to house.(4) The Reserve Bank of New Zealand estimated that Auckland’s construction shortfall between 1996 and 2016 was between 40,000 and 55,000 dwellings, or approximately 10 percent of Auckland’s housing stock.(5) So simply, we’re not building enough to keep up with the demand. Basic rules of supply and demand would show that house prices will increase when demand exceeds supply.
It’s important to remember this increase in population as it helps to understand house prices in Auckland, Auckland these days is a much bigger place than it was 20 years ago. Places like Glen Innes, Massey, Beach Haven etc seemed faaaar away back then, probably like what Pukekohe and Helensville feel like now. In the future however, these places will be gobbled up by the city just like the more central locations feel now.
Inflation
All the above has contributed to house prices rising faster than some would say is reasonable when compared to wage or salary income. However, it shouldn’t discount the fact that incomes have increased in Auckland as well over the years as our tiny nation has grown.
The mean household income has increased on average 6.6% every year to $140,000 in 2020.(6) Inflation has also gone up on average 2.1% since 2000. $1 in 2000 is equivalent to $1.54 now. (7)
Summing it up
Considering the above factors, let’s compare the cost of purchasing a home in Central Auckland in 2000 vs 2021.
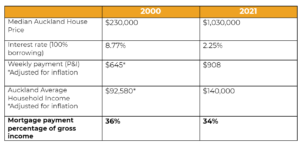
When you put it all together, it’s arguably cheaper now than ever to afford a house. The only thing really holding up people for purchasing their first home is education, mindset and deposit.
We address these three key things in my workshop. If you want to buy your home and defy the narrative that it’s impossible, CLICK HERE TO BOOK NOW
- RNZ Article First Home Buyers https://www.rnz.co.nz/news/business/430938/first-home-buyers-hit-record-high-in-market-share-corelogic-report
- Mortgage calculator: https://sorted.org.nz/tools/mortgage-calculator
- Historical Interest Rates: https://teara.govt.nz/en/graph/23100/interest-rates-1966-2008
- Auckland population stats: https://worldpopulationreview.com/en/world-cities/auckland-population
- RBNZ construction stats: https://www.rbnz.govt.nz/-/media/ReserveBank/Files/Publications/Discussion%20papers/2018/dp18-02.pdf?revision=674c0a80-0353-4808-a10e-5b27dc633da3
- Mean household income: https://ecoprofile.infometrics.co.nz/auckland/StandardOfLiving/Household_Income
- Inflation: https://www.rbnz.govt.nz/monetary-policy/inflation-calculator

Lucia Xiao | support@luciaxiao.co.nz